Debug OpenAI with Smello
The OpenAI Python SDK wraps a complex HTTP API behind convenient methods like client.chat.completions.create(). When something goes wrong (unexpected responses, rate limits, token overages), you need to see the raw API calls. Smello captures the HTTP requests that the OpenAI SDK makes through httpx, showing you exactly what's sent and received.
Setup
Then run your script with smello run:
The OpenAI SDK uses httpx under the hood. Smello's httpx patch captures all API calls automatically. No code changes needed.
Scenario: debugging unexpected token usage
You're making chat completion calls and your token usage is higher than expected. Is it the system prompt? Are previous messages being included that you didn't intend?
client = OpenAI()
response = client.chat.completions.create(
    model="gpt-4o",
    messages=build_messages(user_input),
)
# usage.total_tokens is 12,000: way more than expected
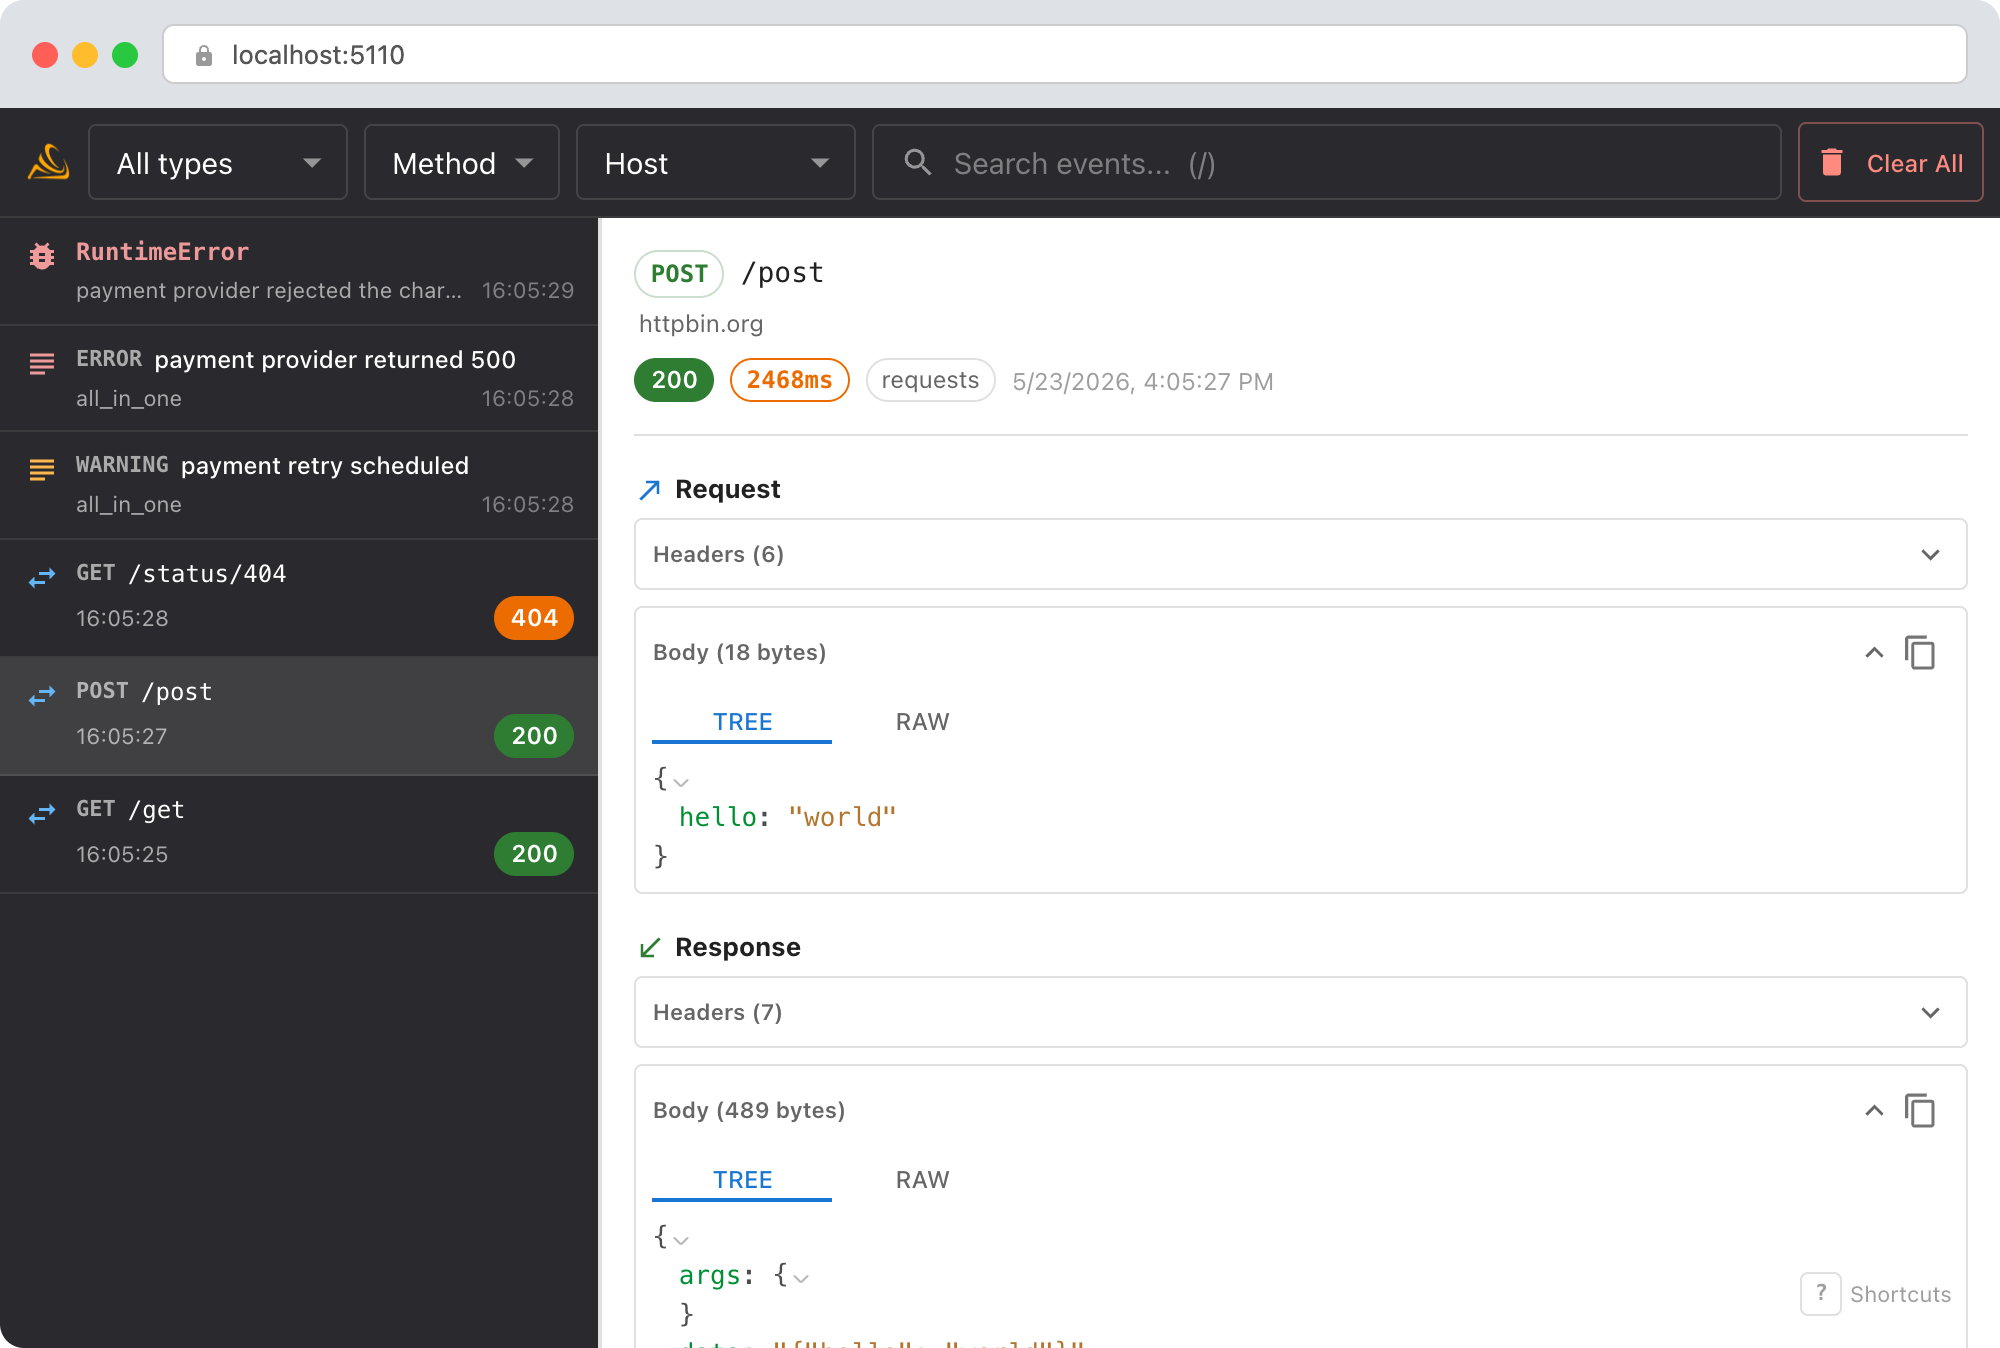
Debug in the dashboard
Open the Smello dashboard and click the request to api.openai.com/v1/chat/completions:
- Request body: see the full
messagesarray that was sent. Isbuild_messages()including the entire conversation history? Is the system prompt larger than you thought? - Response body: the
usageobject showsprompt_tokens,completion_tokens, andtotal_tokens. Compareprompt_tokenswith what you expected from your message array. - Request headers: confirm which API key and organization are being used (redacted by default, but the
OpenAI-Organizationheader is visible).
The LLM conversation view
For OpenAI requests and responses, Smello detects the chat shape and defaults to an LLM tab that renders the call as a conversation instead of raw JSON:
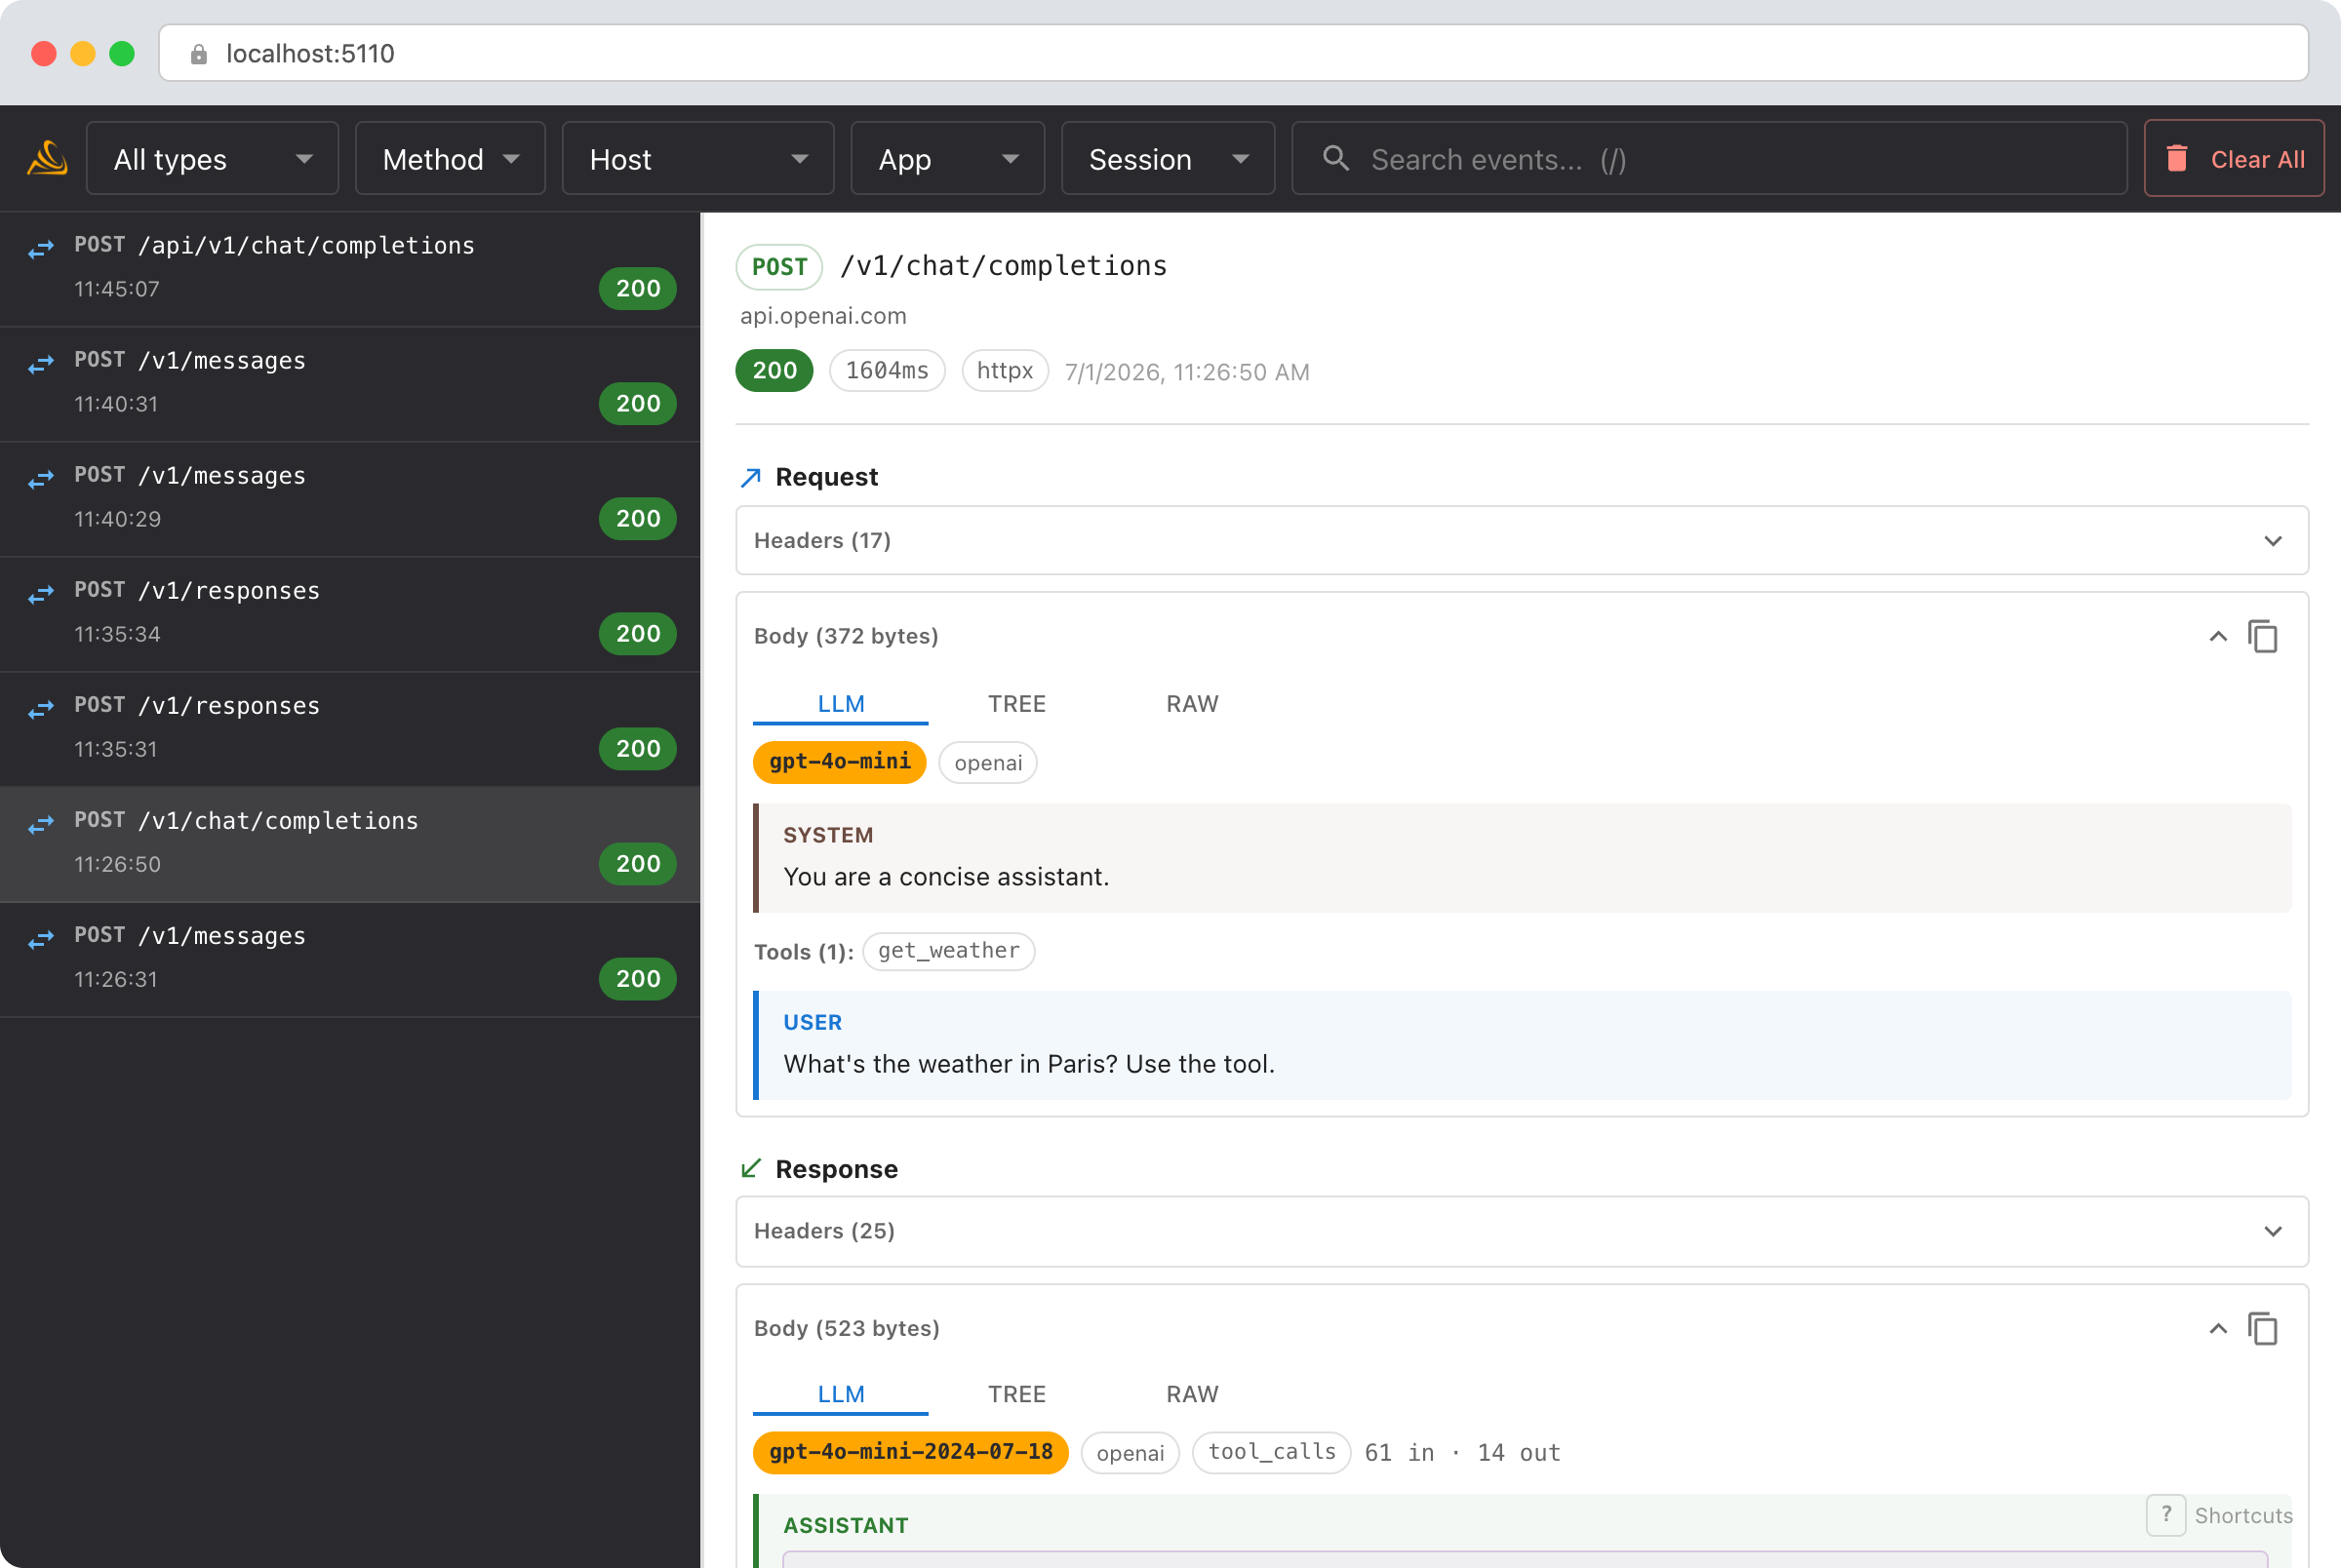
- System prompt and tools are pulled out of the payload and shown at the top, so you can see the full instructions and every tool definition at a glance.
- Messages appear as labeled turns (system / user / assistant / tool). Tool calls render as cards with their JSON arguments; tool results render alongside the call that produced them.
- Model, stop reason, and token usage sit in a compact header strip on the response.
This works for the Chat Completions and Responses APIs, and for SDKs built on top of OpenAI (OpenAI Agents, Pydantic AI, OpenRouter). Streaming Chat Completions responses are reassembled into the same view. The Tree and Raw tabs are always there when you need the exact bytes.
Debug with an AI agent
If you use Claude Code or another AI coding tool, the /smello skill can query captured events and cross-reference them with your source code. Install it once:
Then ask your agent:
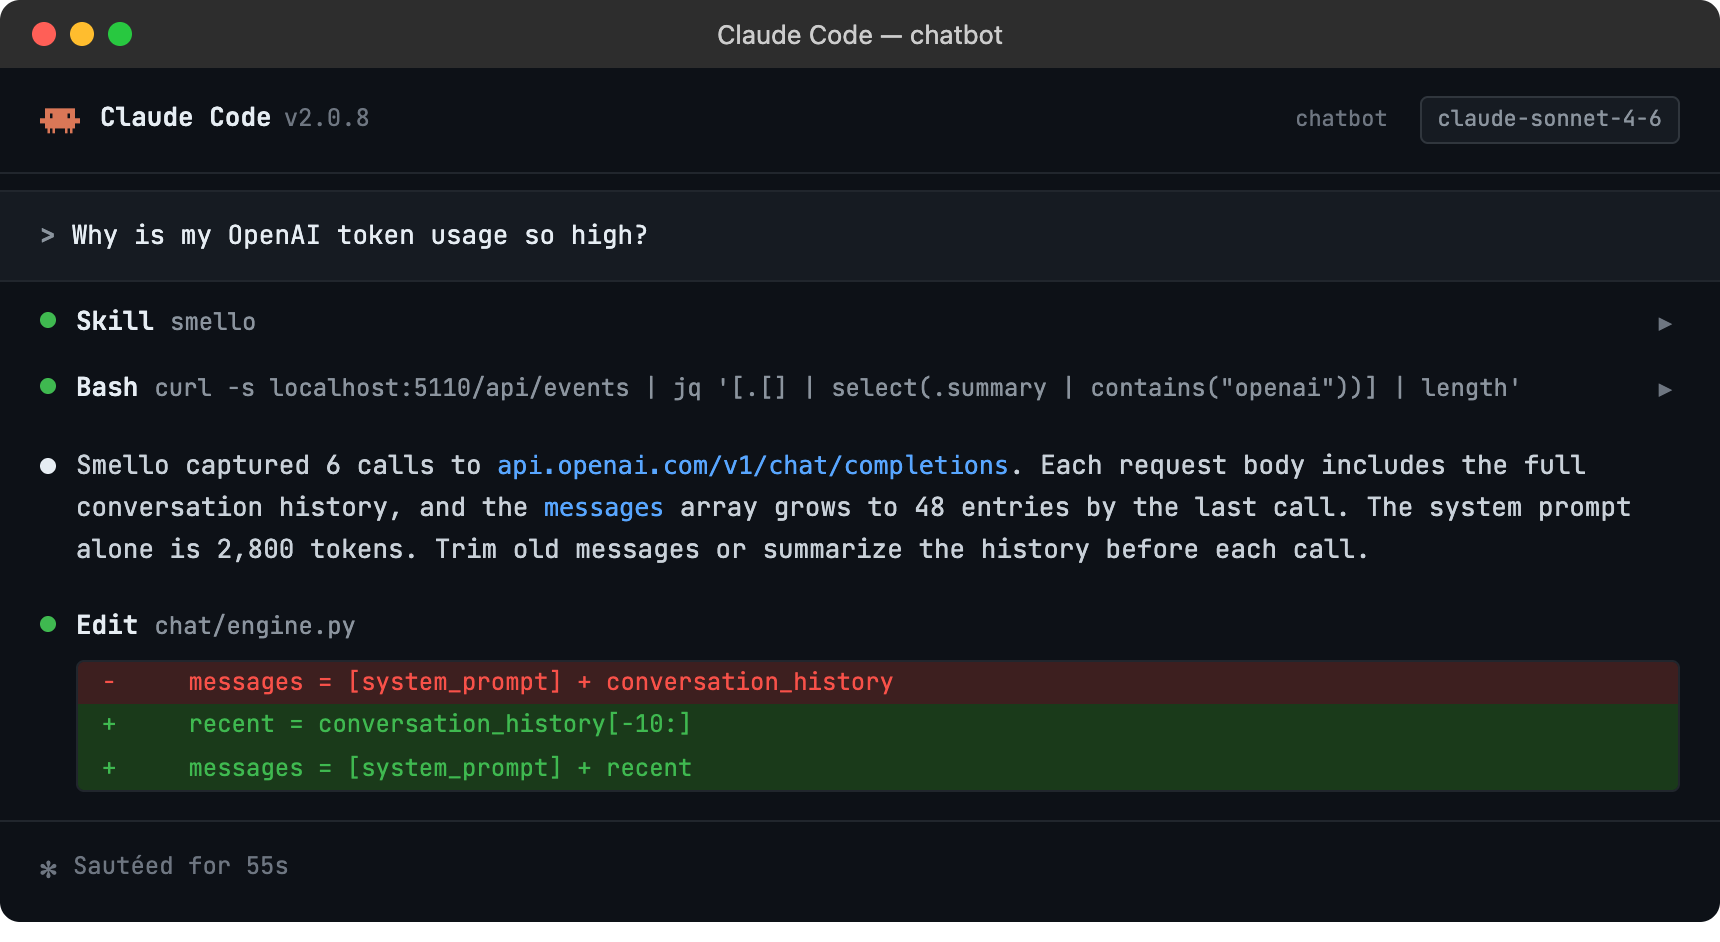
The skill is also invoked automatically when your agent recognizes a debugging question, but calling /smello explicitly gives the best results. See AI Agent Skills for compatible tools.
Tips
- Streaming responses: When using
stream=True, Smello captures the initial request and the full response. You can see the complete streamed output in the response body, even though your code received it token by token. - Rate limit headers: OpenAI returns
x-ratelimit-remaining-requests,x-ratelimit-remaining-tokens, and related headers. These are visible in the response headers panel: useful for understanding why you're hitting rate limits. - Function calling / tools: If you're using function calling, the tool definitions are part of the request body and the tool call responses are in the response body. Smello shows both, so you can debug tool-use flows.
- Multiple API calls: Chat, embeddings, image generation, and file uploads all go through the same httpx client. You'll see all of them in the timeline, filterable by URL.
- Retries: The OpenAI SDK retries on certain errors automatically. Each attempt appears as a separate request in Smello, so you can see what was retried and why.
Next step: follow the getting started guide for installation, configuration, and more.