Debug FastAPI with Smello
Smello's FastAPI middleware captures incoming HTTP requests to your FastAPI application: the request path, headers, body, response, and timing. Combined with the automatic outgoing HTTP capture, you get a complete view of what your API endpoint received and what external calls it made to handle it.
Setup
Add the Smello middleware to your FastAPI app:
from fastapi import FastAPI
from smello.integrations.fastapi import SmelloMiddleware

app = FastAPI()
app.add_middleware(SmelloMiddleware)
Then run your server with smello run:
Incoming request capture is the one integration that requires a code change: adding the middleware line. Outgoing HTTP, exceptions, and logs are all captured automatically by smello run.
Example script:
fastapi_server.py
Scenario: debugging a 500 error on a checkout endpoint
Your /api/checkout endpoint returns 500 intermittently. The logs say "internal server error" but don't show what went wrong. What did the client send? What external calls did your handler make?
@app.post("/api/checkout")
async def checkout(order: OrderRequest):
    customer = await stripe_client.get_customer(order.customer_id)
    charge = await stripe_client.create_charge(customer, order.amount)
    await send_confirmation_email(customer.email, charge.id)
    return {"charge_id": charge.id}
Debug in the dashboard
Open the Smello dashboard. You'll see the incoming request and all the outgoing calls it triggered:
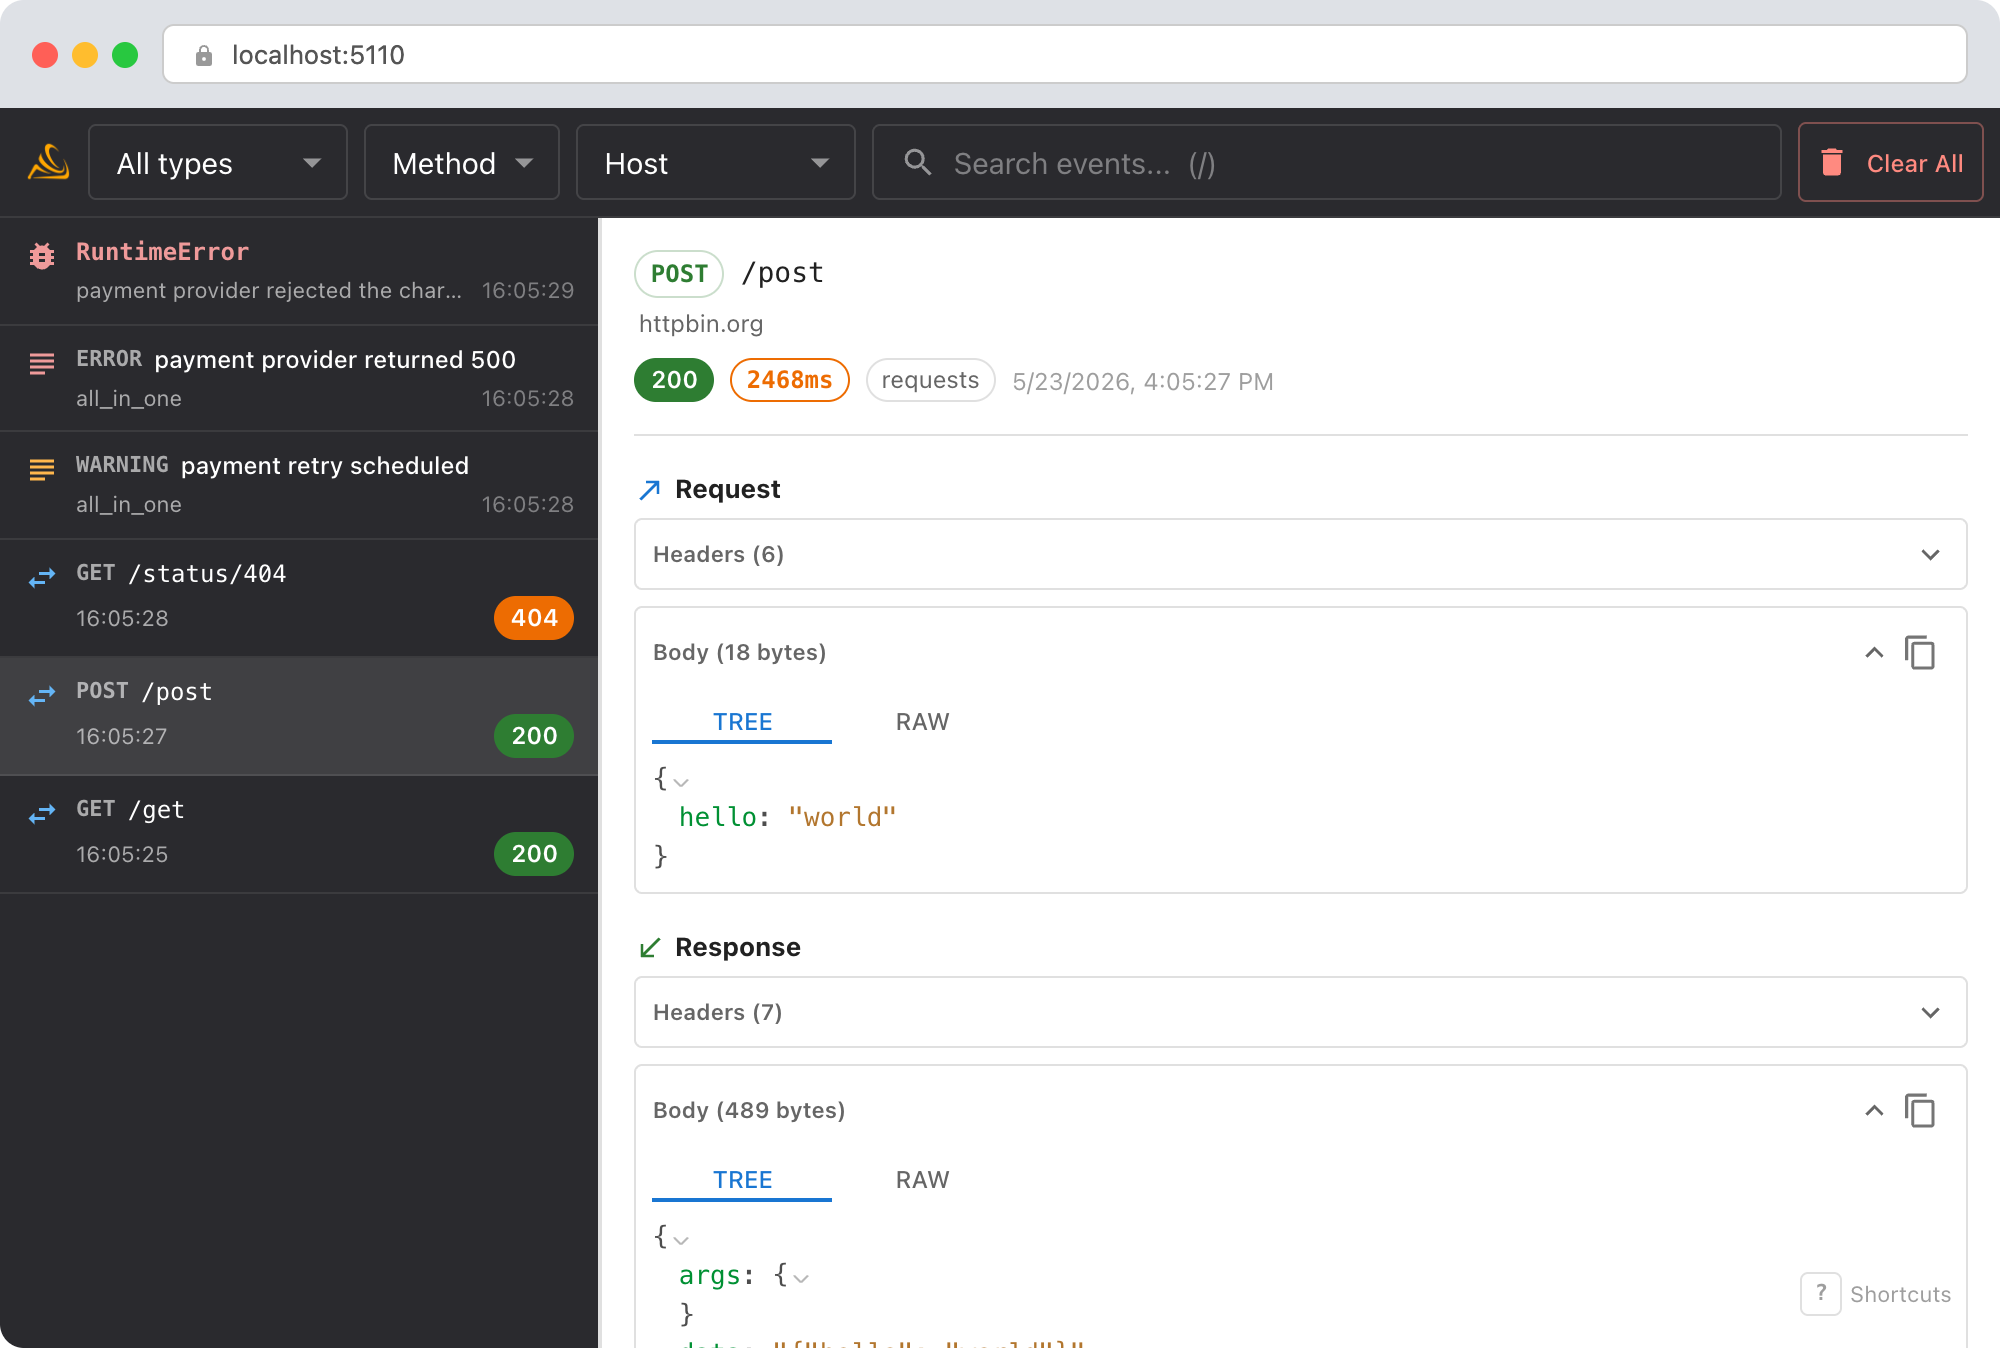
- Incoming request: the full
POST /api/checkoutwith the request body, headers, and the 500 response. Check the request body to see if the client sent valid data. - Outgoing calls: the Stripe API call and the email service call appear in the timeline right after the incoming request. Did the Stripe call succeed but the email call fail?
- Exception capture: if the 500 was caused by an unhandled exception, Smello captures the full traceback. You'll see the exception type, message, and stack frames in the dashboard.
- Duration: the incoming request shows total duration. Compare it with the outgoing call durations to understand where time was spent.
Debug with an AI agent
If you use Claude Code or another AI coding tool, the /smello skill can query captured events and cross-reference them with your source code. Install it once:
Then ask your agent:
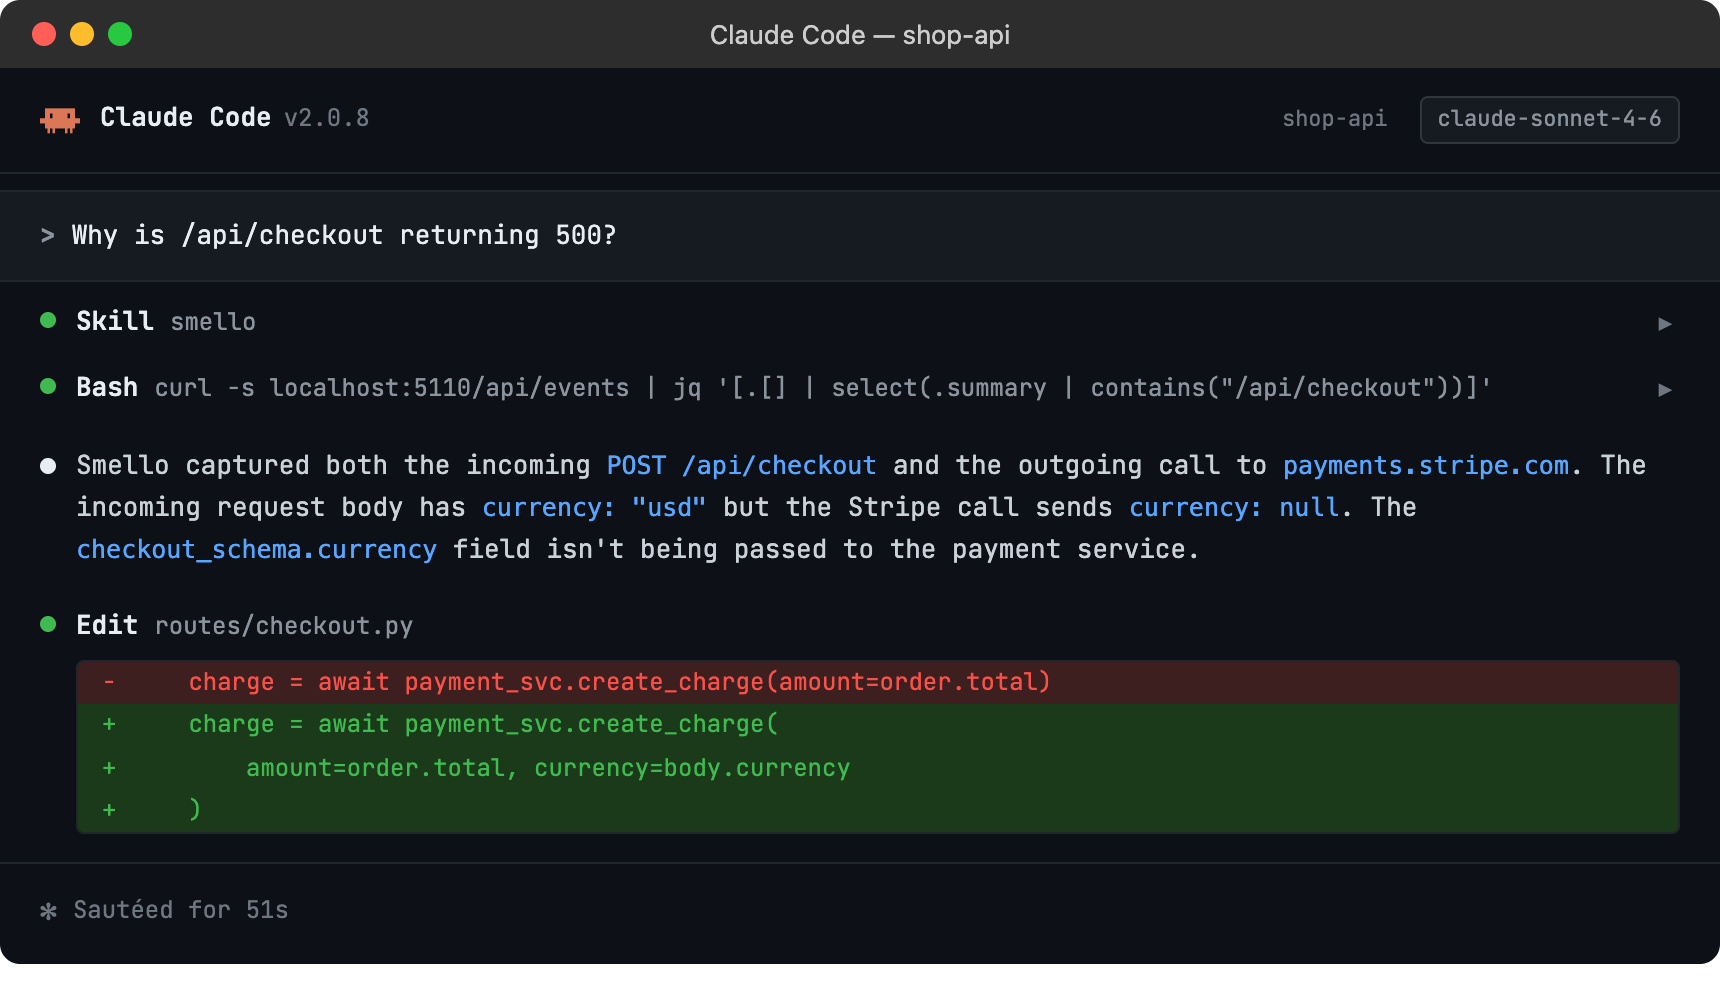
The skill is also invoked automatically when your agent recognizes a debugging question, but calling /smello explicitly gives the best results. See AI Agent Skills for compatible tools.
Tips
- Exception visibility: The FastAPI middleware captures exceptions that propagate through your handlers. These appear as exception events in the dashboard with full tracebacks, linked to the incoming request that triggered them.
- Route matching: The captured incoming request shows the matched route pattern (e.g.,
/api/users/{user_id}) alongside the actual URL. This helps when debugging path parameter issues. - Middleware order: Add
SmelloMiddlewarebefore other middleware that might modify the request or response. Smello captures what it sees, so putting it first gives you the raw client request. - Filtering: Use the event type filter in the dashboard to focus on incoming requests only, or use the timeline view to see incoming and outgoing requests interleaved.
- Health checks: If your app has health check endpoints that generate noise, use
ignore_pathsin the middleware configuration to exclude them.
Next step: follow the getting started guide for installation, configuration, and more.