Debug Anthropic with Smello
The Anthropic Python SDK uses httpx to communicate with the Claude API. Smello captures every API call, letting you inspect message payloads, tool definitions, token usage, and streaming responses in the dashboard.
Setup
Then run your script with smello run:
The Anthropic SDK uses httpx under the hood. Smello captures all API calls automatically. No code changes needed.
Scenario: debugging a tool-use loop that makes too many API calls
You're building an agent with Claude's tool use, and it's making more API calls than expected. Is Claude calling tools unnecessarily? Is the loop terminating correctly?
client = anthropic.Anthropic()
messages = [{"role": "user", "content": "What's the weather in Paris?"}]

while True:
    response = client.messages.create(
        model="claude-sonnet-4-5-20250929",
        messages=messages,
        tools=tools,
        max_tokens=1024,
    )
    if response.stop_reason == "end_turn":
        break
    # process tool calls and continue...
Debug in the dashboard
Open the Smello dashboard. You'll see every POST to api.anthropic.com/v1/messages:
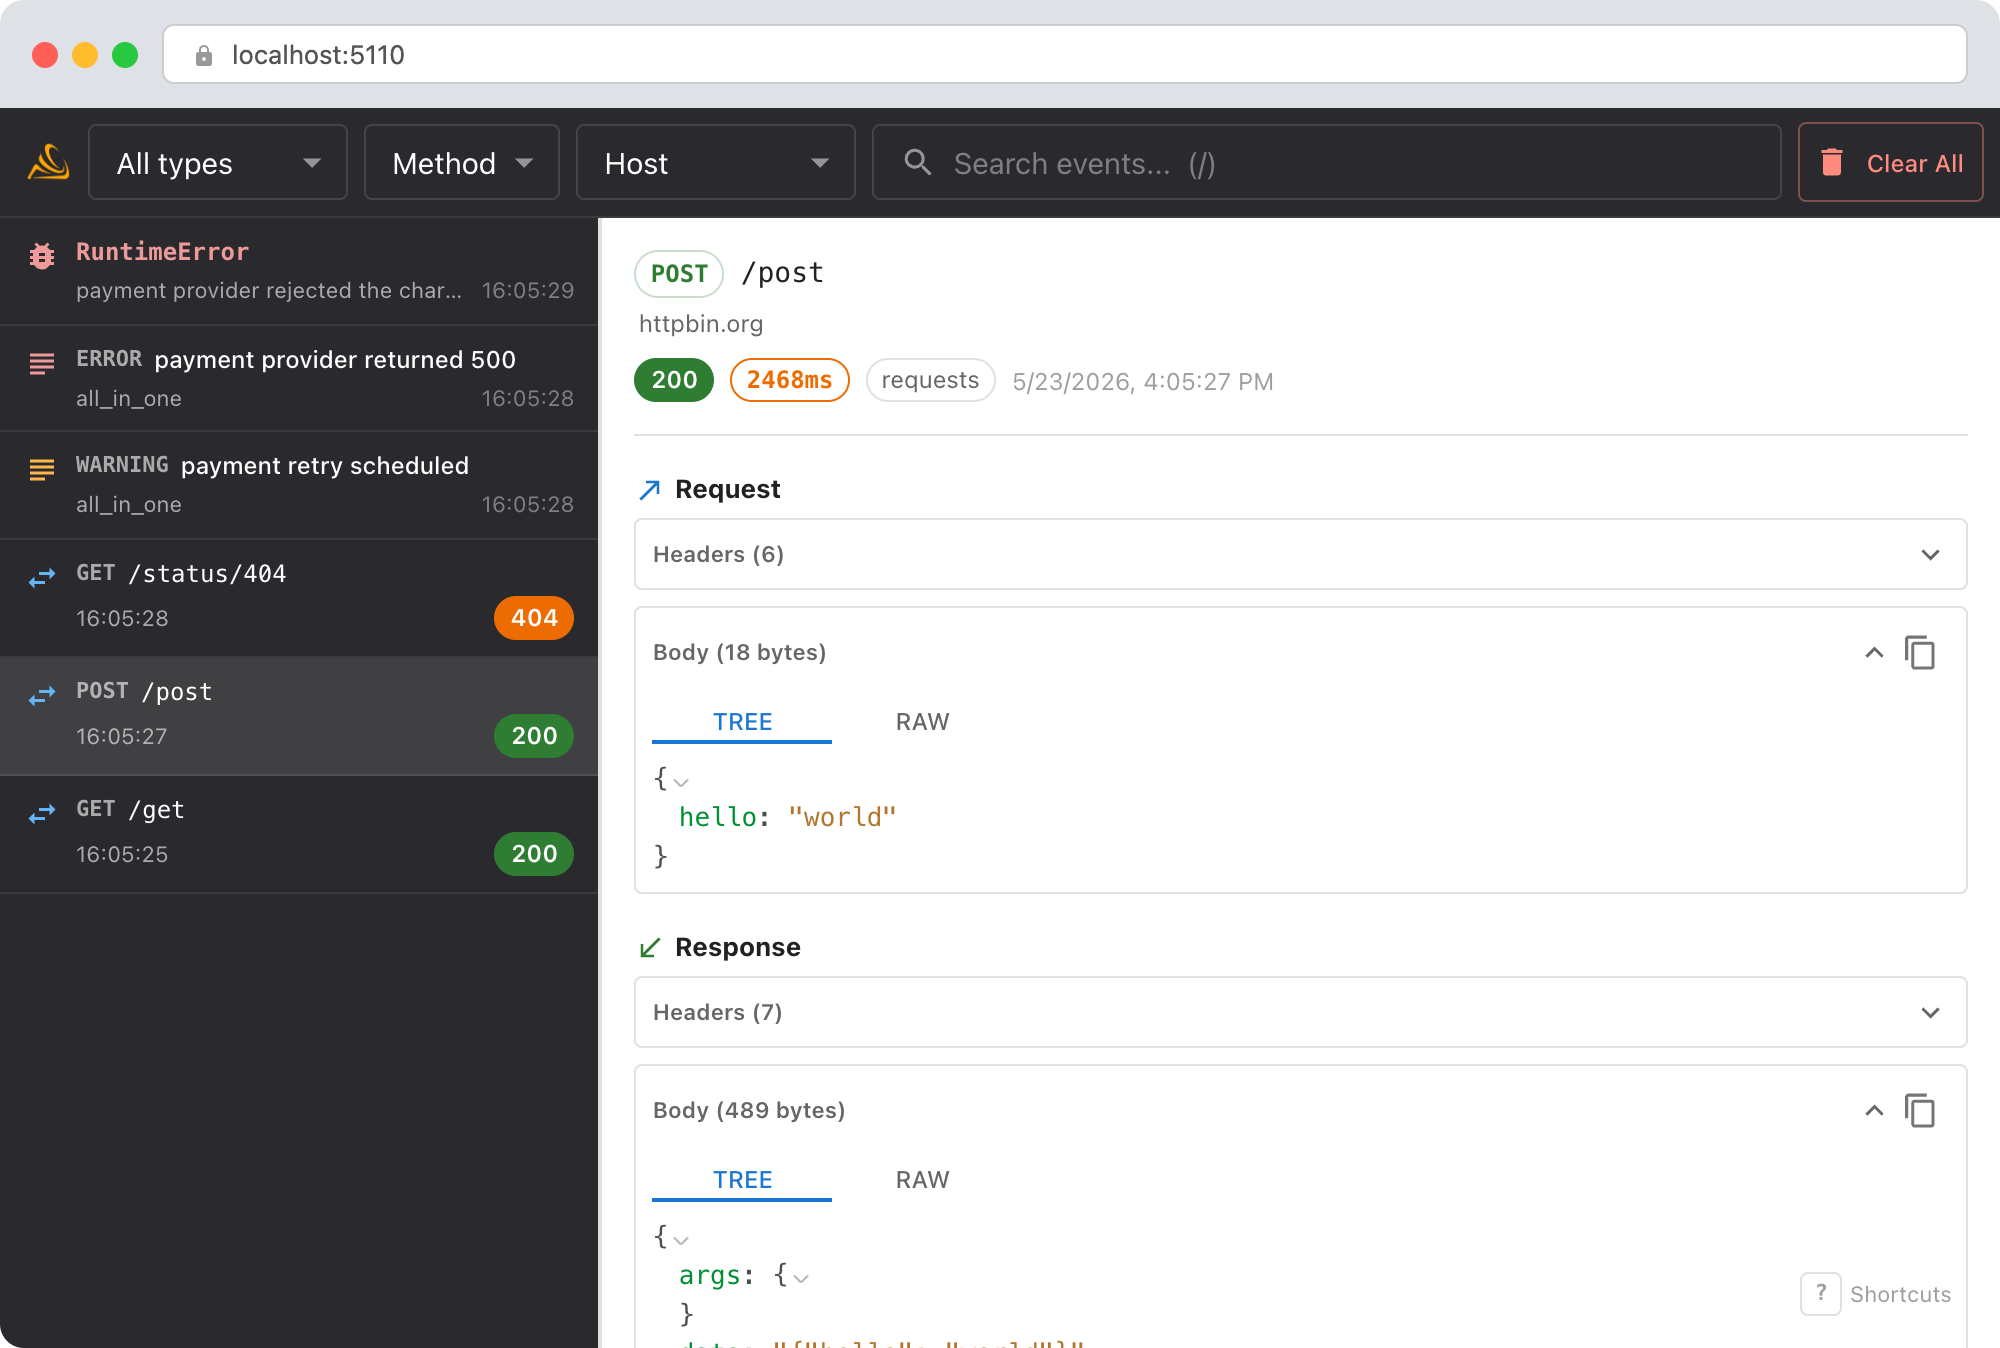
- Request bodies: see how the
messagesarray grows with each loop iteration. Are previous tool results being appended correctly? - Response bodies: check
stop_reasonfor each response. Is Claude returningtool_usewhen it should be returningend_turn? - Token usage: each response includes
usage.input_tokensandusage.output_tokens. Watch how input tokens grow as the conversation gets longer. - Timeline order: the dashboard shows requests in order, so you can trace the exact sequence of the agent loop.
The LLM conversation view
For Messages API calls, Smello detects the shape and defaults to an LLM tab that renders the request and response as a conversation instead of raw JSON:
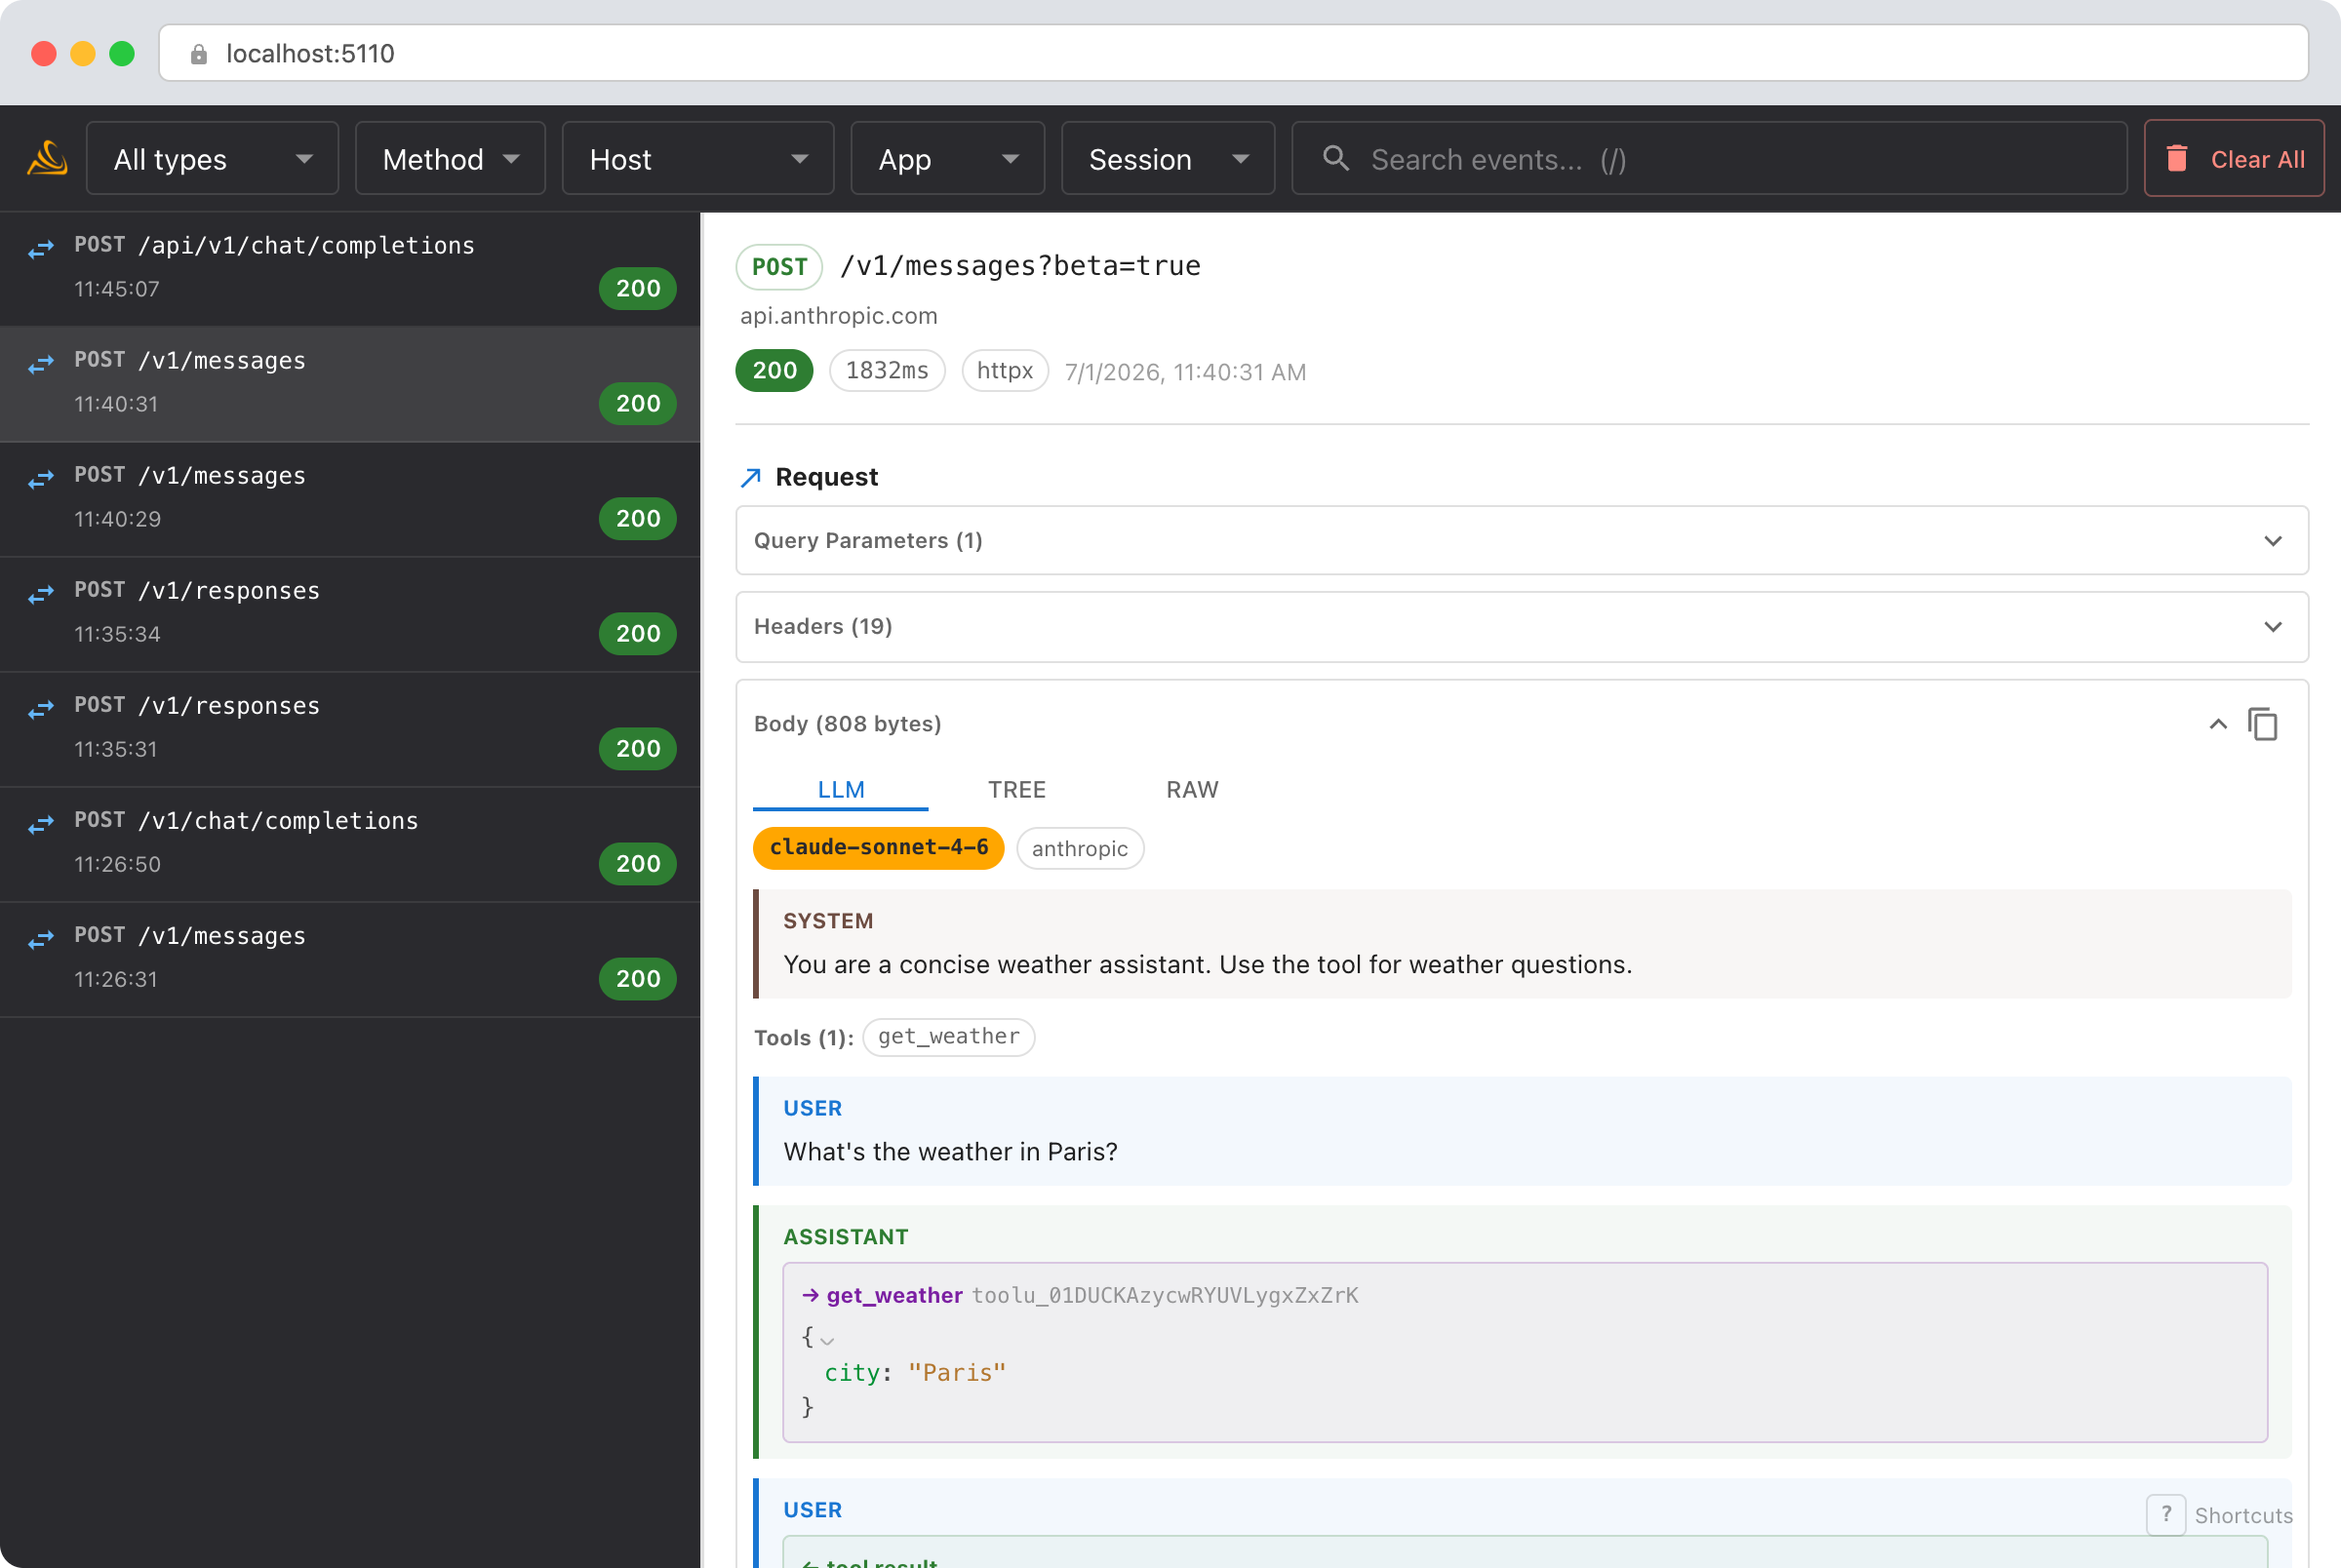
- System prompt and tools are lifted to the top of the view, so a long system prompt or a big
toolsarray no longer buries the actual messages. - Messages render as labeled turns.
tool_useblocks become tool-call cards with their JSON input,tool_resultblocks become result cards, andthinkingblocks render inline (muted), so a whole tool-use loop reads top to bottom. - Model, stop reason, and token usage (including cache read/write) sit in a compact header strip on the response.
Streaming responses are reassembled into the same view. The Tree and Raw tabs remain available for the exact payload.
Debug with an AI agent
If you use Claude Code or another AI coding tool, the /smello skill can query captured events and cross-reference them with your source code. Install it once:
Then ask your agent:
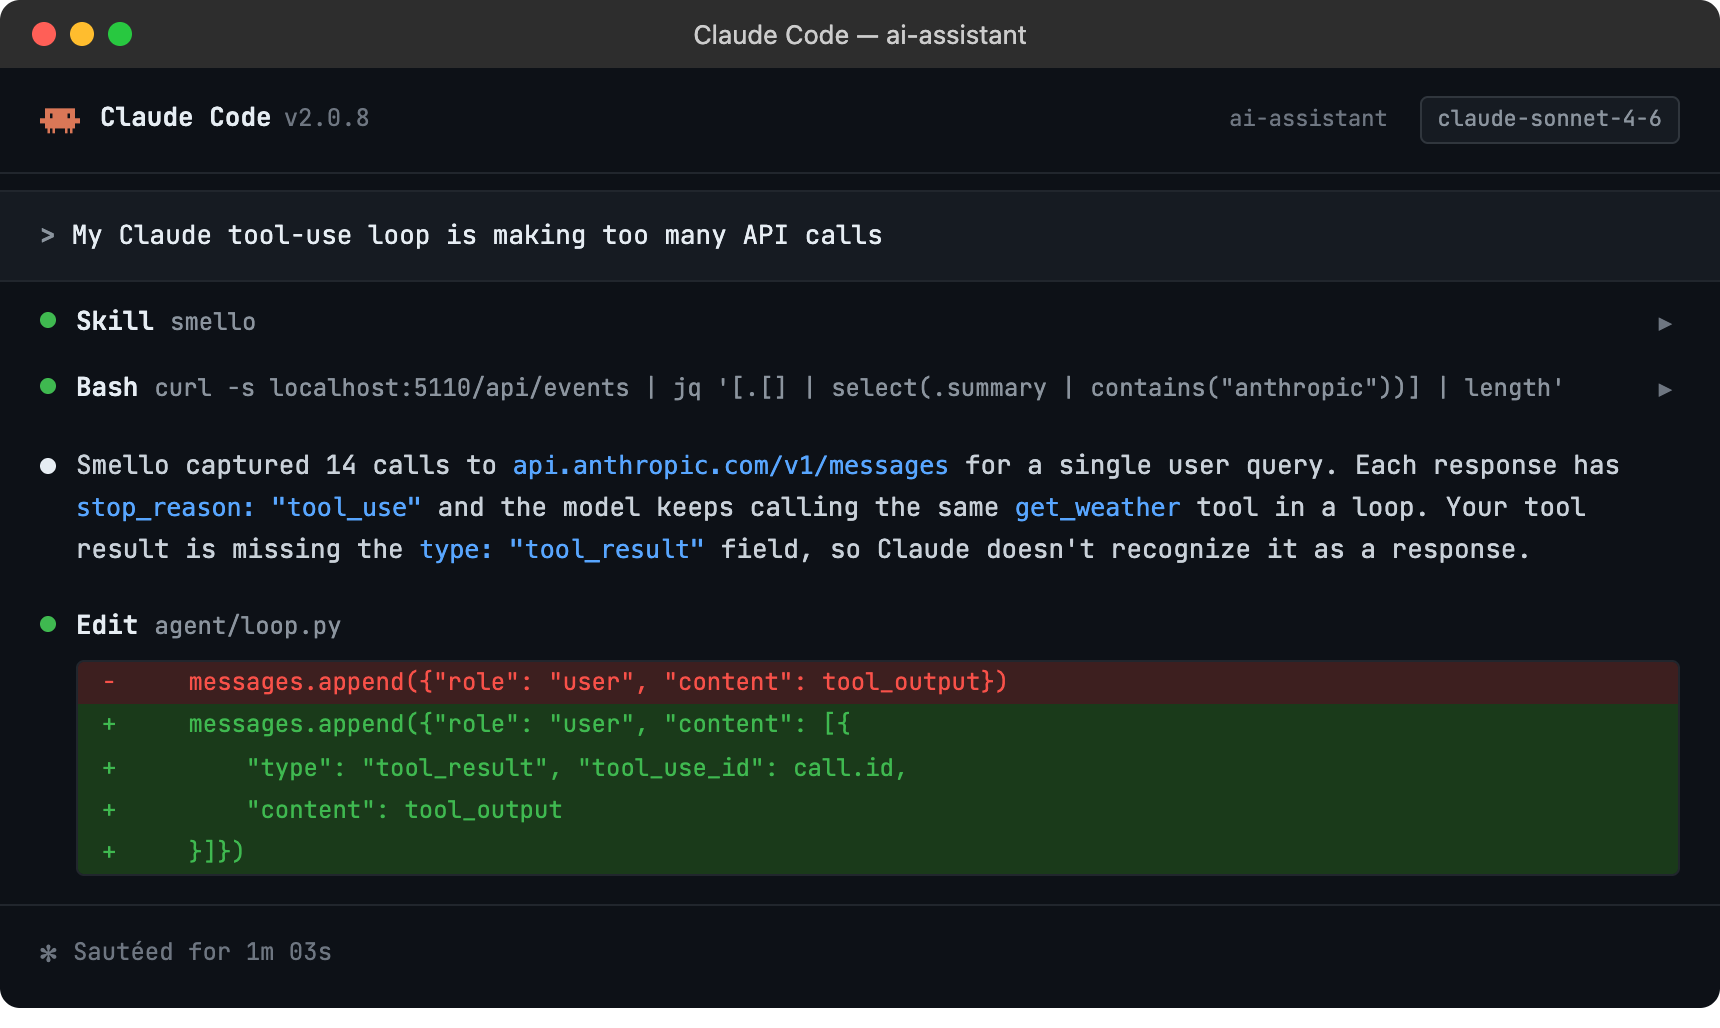
The skill is also invoked automatically when your agent recognizes a debugging question, but calling /smello explicitly gives the best results. See AI Agent Skills for compatible tools.
Tips
- Streaming: When using
client.messages.stream(), Smello captures the full response body. You can see the complete output even though your code consumed it as server-sent events. - Token counting: Each response's
usagefield is in the response body. Compareinput_tokensacross requests to understand how your context window fills up. - System prompts: The system prompt is part of the request body. If you're debugging unexpected Claude behavior, check that the system prompt in the captured request matches what you intended.
- Rate limits: Anthropic returns rate limit headers (
anthropic-ratelimit-requests-remaining, etc.) in every response. These are visible in the response headers panel. - Retries: The Anthropic SDK retries on overloaded (529) and rate limit (429) errors. Each attempt shows up separately in the timeline.
Next step: follow the getting started guide for installation, configuration, and more.